Stop Reading Logs. Ask Your Traces
in Plain English
AI-powered debugging companion for Pydantic Logfire. Ask questions about your traces — get SQL queries, data tables, and charts back instantly.
Built with
 FastAPI
  Pydantic AI
  PostgreSQL
  Redis
Redis  React
React  TypeScript FastAPI Pydantic AI PostgreSQL Redis React TypeScript
 Why use this?
Without Logfire Assistant
- ✗ Writing SQL queries manually against Logfire schema
- ✗ Context-switching between Logfire dashboard and tools
- ✗ No automatic visualization of query results
- ✗ Repeating common queries from memory
- ✗ No conversation history or context
With Logfire Assistant
- ✓ Ask questions in plain English
- ✓ Inline sidebar right in the Logfire dashboard
- ✓ Auto-generated tables and charts
- ✓ Reusable prompt templates with slash commands
- ✓ Full conversation history with project filtering
Everything you need to debug smarter
From natural language queries to auto-generated visualizations.
Natural Language Queries
Ask about your traces in plain English. No SQL knowledge required — the assistant translates your questions automatically.
Auto SQL Generation
Pydantic AI agent translates questions to optimized Logfire SQL. View the generated query or just read the results.
Auto Visualizations
Charts and data tables generated automatically from query results. Bar charts, timelines, and structured summaries.
Span Context Analysis
Click any span in Logfire — the assistant captures trace_id, span_id, and full context for precise debugging.
Custom Prompts
Create reusable prompt templates with slash commands. Built-in prompts for /errors, /costs, /slow, /performance, and more.
Conversation Memory
Full conversation history with search and project filtering. Resume any debugging session where you left off.
How does it compare?
See how it stacks up against alternatives.
| Feature | Logfire Assistant | Manual SQL | Generic AI Chat |
|---|---|---|---|
| Logfire-native SQL | ✓ | ✓ | ✗ |
| Span Context Aware | ✓ | ✗ | ✗ |
| Auto Charts | ✓ | ✗ | ✗ |
| Custom Prompts | ✓ | ✗ | Partial |
| Conversation History | ✓ | ✗ | ✓ |
| Natural Language Input | ✓ | ✗ | ✓ |
How it works
From question to insight in seconds.
Ask a question
Type in plain English — "What were the slowest requests in the last hour?"
AI generates SQL
Pydantic AI agent translates your question to optimized Logfire SQL.
Query executes
SQL runs against the Logfire API. Results stream back in real-time via WebSocket.
Get insights
Data tables, charts, or narrative answers — exactly what you need to debug.
Built for real debugging
From slow requests to cost tracking.
Debug Slow Requests
Find bottlenecks instantly. Ask which endpoints are slowest and get span-by-span timing breakdowns.
- — Endpoint latency ranking
- — Span-by-span timing
- — Percentile analysis (p50, p95, p99)
- — Comparison across time periods
LLM Usage & Costs
Track token usage, costs, and call counts across all your LLM providers in one place.
- — Token usage by model
- — Cost breakdown per provider
- — Usage trends over time
- — Auto-generated cost charts
Error Analysis
Find error patterns, frequencies, and root causes. Get structured analysis of what went wrong.
- — Error frequency patterns
- — Root cause analysis
- — Error trends over time
- — Affected endpoint mapping
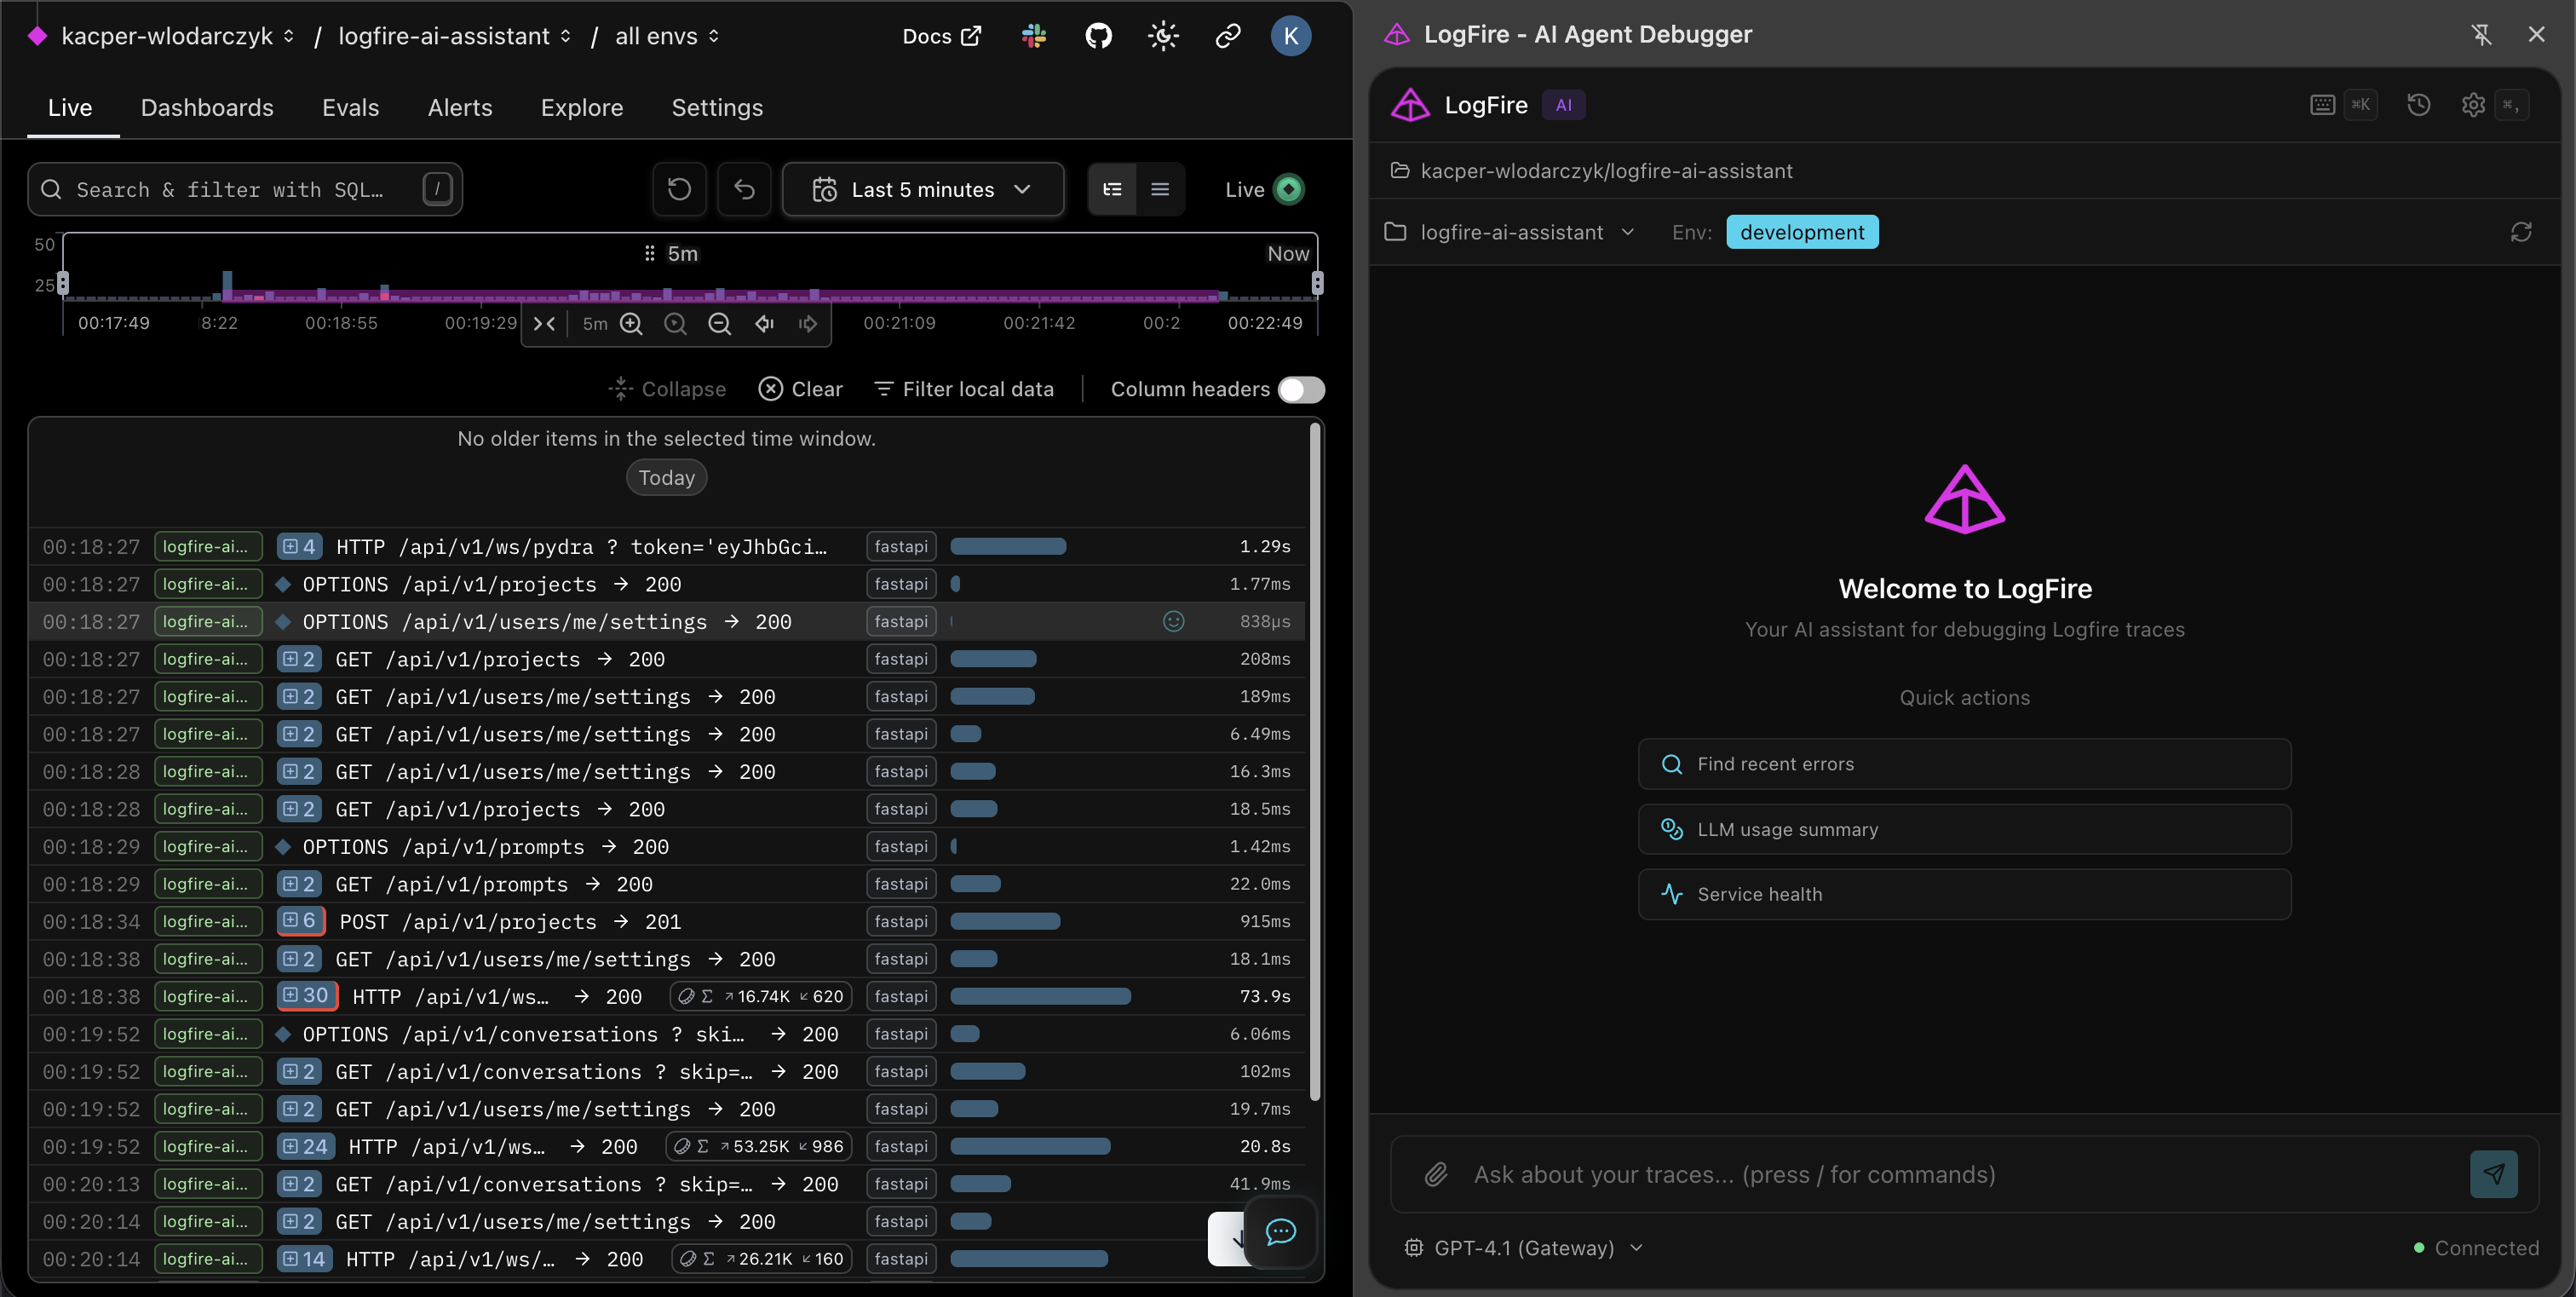
See it in action
A Chrome extension that lives right next to your Logfire dashboard.
Data tables
Auto charts
SQL generation
Span context
Custom prompts
History
Frequently Asked Questions
Everything you need to know about our tools and projects.
What is Logfire Assistant?
Do I need a Logfire account?
Which LLM providers work?
Can I create custom prompts?
Is my data stored?
Ready to stop reading logs line by line?
Install the extension, connect to Logfire, and ask your traces questions in plain English. Free and open-source.